Write your data analysis
This section and the next, on reporting and discussing your findings, deal with the body of the thesis. In a doctoral thesis, this will consist of a number of chapters. This is where you present the data that forms the basis of your investigation, shaped by the way you have thought about it. In other words, you tell your readers the story that has emerged from your findings. The form of these central chapters should be consistent with this story and its components.
Every thesis writer has to present and discuss the results of their inquiry. In this website we consider these two activities separately, while recognising that in many kinds of thesis they will be integrated. This section is concerned with presenting the analysis of the data.
In this part of research writing there is a great deal of variation. For example, a thesis in oral history and one in marketing may both use interview data that has been collected and analysed in similar ways, but the way the results of this analysis are presented will be very different because the questions they are trying to answer are different. The presentation of results from experimental studies will be different again. In all cases, though, the presentation should have a logical organisation that reflects:
- the aims or research question(s) of the project, including any hypotheses that have been tested
- the research methods and theoretical framework that have been outlined earlier in the thesis
You are not simply describing the data. You need to make connections, and make apparent your reasons for saying that data should be interpreted in one way rather than another.
Structure
Each chapter needs an introduction outlining its organisation.
Example from a Chemical Engineering PhD thesis:
In this Chapter, all the experimental results from the phenomenological experiments outlined in Section 5.2 are presented and examined in detail. The effects of the major operating variables on the performance of the pilot filters are explained, and various implications for design are discussed. The new data may be found in Appendix C.
Example from a Literature PhD thesis:
The principal goal of the vernacular adaptor of a Latin saint’s life was to edify and instruct his audience. In this chapter I shall try to show to what extent our texts conform to vernacular conventions of a well-told story of a saint, and in what ways they had to modify their originals to do so, attempting also to identify some of the individual characteristics of the three poems.
After that, the organisation will vary according to the kind of research being reported. Below are some important principles for reporting experimental. quantitative (survey) and qualitative studies .
Your data will be presented in the form of tables, graphs and diagrams, but you also need to use words to guide readers through your data:
- Explain the tests you performed (and why).
- Explain how you gathered the data.
- Present your results. Choose those that show something interesting and that your experiments support your conclusions. Show any negative results too, and try to explain them.
- Indicate what results are significant.
- Make meaningful comparisons.
- Draw any immediate conclusions.
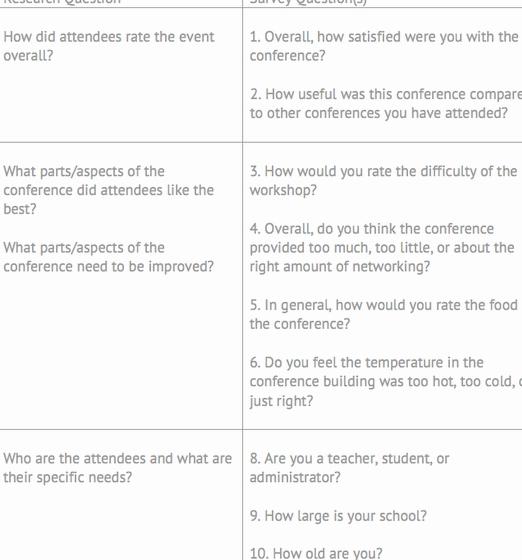
There are generally accepted guidelines for how to display data and summarize the results of statistical analyses of data about populations or groups of people, plants or animals. However, this display needs to be presented in an informative way.
- Describe the sample.
- Remind the reader of the research question being addressed, or the hypothesis being tested.
- Tell the reader what you want him/her to get from the data.
- State which differences are significant.
- Highlight the important trends and differences/comparisons.
- Indicate whether the hypothesis is confirmed, not confirmed, or partially confirmed.
The analysis of qualitative data cannot be neatly presented in tables and figures, as quantitative results can be. It must all be expressed in words, and this results in a large quantity of written material, through which you must guide your reader.
Structure is therefore very important. Try to make your sections and subsections reflect your thematic analysis of the data, and to make sure your reader knows how these themes evolved. Headings and subheadings, as well as directions to the reader, are forms of signposting you can use to make these chapters easy to navigate.
What to include
For all types of research, the selection of data is important. You will not include pages of raw data in your text, and you may not need to include it all in an appendix either.
- Include what you need to support the points you want to make.
- Make your selection criteria explicit.
- Evans and Gruba (2002) offer some good advice about how much to put in an appendix: ‘Include enough data in an appendix to show how you collected it, what form it took, and how you treated it in the process of condensing it for presentation in the results chapter.’ (p. 105)
Download a printable version of this page.
Problems? Questions? Comments? Please provide us feedback.


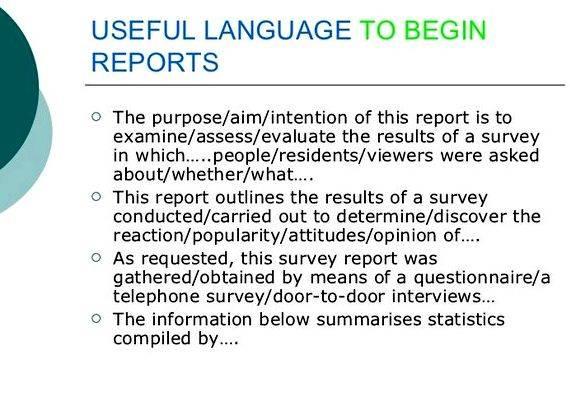

 Gheens academy on demand writing powerpoint
 Writing if then hypothesis worksheets
 Anatomy of writing for publication
 Perodua myvi 1.3 ezi specification writing
 Improve your ielts writing skills online
