There are many claims that are made which are suspect. Have you ever wondered if really “four out of five dentists surveyed recommend sugarless gum to their patients who chew gum” or if “people prefers Hardees chicken 2 to 1 over KFC’s chicken”? Maybe you work for a company which claimed “100% participation” in the United Way fund drive but know that you didn’t participate and wonder how the company can make such a blatantly false statement.
Your task is to perform some real-world inferential statistics. Try to come up with something of interest to you instead of some contrived situation. I have had people ask managers something about their business and then testing to see if the manager knew what s/he was talking about (ex: KFC’s average serving time is 30 seconds or 57% of all drinks sold at Carlos O’Kelly’s are Marguerites). Some have challenged a commercial advertisement (ex: people prefer Hardees chicken 2:1 over KFC’s). Still others have tested the claim that local data is different from the national data (ex: The percentage of blood types in McLean county is different from the national percentages). One group tested to see whether the percentage of in town drivers wearing their seat belts was different from the percentage of out of town drivers wearing their seat belts.
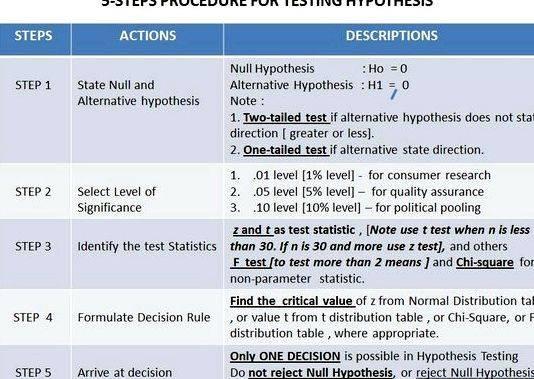
The project will involve forming a hypothesis, then collecting the data necessary to conduct the test of the hypothesis, and finally analyzing and interpreting the results. Projects which involve using pre-existing data, rather than the collecting of data through sampling will require more analysis since the work of data collection was less involved.
You may work in groups of up to four (4) persons.
Pick people you can work with; part of the grade will be assigned by the people in the group as to the work you contributed.
You need to submit a proposal defining what it is that you wish to test, and how you wish to go about testing it (think back to the types of sampling). The instructor will peruse these proposals, make suggestions and give it back to you. The proposal will be included as part of the final project (which must be typed). If your group can’t decide on a project or need help defining it, see the instructor.
Be sure to define clearly what the population being studied is (Richland Students, People listed in the Decatur phone book, People driving a car, etc).
The project will be comprised of several parts, due at different times during the remainder of the semester.
Pre-project proposal (10 points).
This is to make sure you’re on the correct tract before wasting lots of time collecting useless information.
Rough Draft (10 points)
This is a rough draft of the final report so the instructor can suggest corrections.
Final report (60 points)
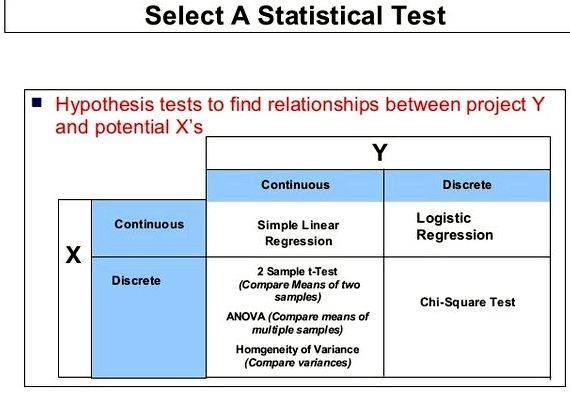
The final report will include a description of the problem, and why you think it is important, or what you hope to gain from testing the hypothesis. It should also include all data collected, the statistical formulas used to perform the hypothesis test (you may write the formulas by hand) and the values generated by Statdisk. A decision and conclusion should be stated. An analysis should follow with what the conclusion means in terms of the original problem.
Presentation (10 points)
Classroom presentation of 5-10 minutes on why you picked the project you did, and what your results were. The class and/or instructor may ask questions on why you did something the way you did.
Self-evaluation (10 points)
Evaluate yourself and the other people in your group as to their ability to perform within a group and their ability to do assigned work.
Some of your projects will require information from sections in the book not yet covered. See the instructor if you have trouble identifying these areas. If you read the section(s) and don’t understand the material, see the instructor for an explanation. Don’t wait for the class to cover the material, it may be too late.
Some previous projects:
- Are the rates paid by the insurance company for dental cleaning in line with the rates charged by the dentists? A student called 30 dentists to find out the rates.
- Are serving times at Kentucky Fried Chicken less than the thirty seconds claimed? A student used the computer records during different times of the days. In the same vein, other students have sat in McDonald’s for an hour and timed the delivery of the orders.
- Does the blood type ratios in McClean county agree with the national percentages as published by the American Red Cross? Students went through Red Cross records using stratified sampling until there were over two hundred people in the sample.
- Does the percent of in-town drivers wearing seatbelts differ from the percent of out-of town drivers wearing seatbelts? Idea is good, implementation by the group was poorly planned.
- Does a certain percentage of Dentists recommend a particular brand as claimed in their ad? This group sent away for the information from the company and then did analysis on it.
- Is the incidence of AIDS on the rise? Data from the Statistical Abstract was used and compared using ratios and differences to test for an increase.
- Did O.J. Simpson murder his ex-wife Nicole? Stratified sampling was used to ask 120 people in four groups of 30 (white male, white female, black male, black female) and analysis was done between the different groups as well as by sex and by race.
- A company claimed that the machine produced parts that were acceptable 90% of the time. They collected printouts of runs from the machines and tested the claim.
- A machine used as the Clinton Power Plant for measurements was tested daily to see if it was accurate. The student collected data from the machine to see if it was within the specified tolerance at least 95% of the time.
- People were asked if they prefer Pepsi or Coke, and then given a taste test to see which they preferred.
- Medicare payments at a local health care provider were tested to see if they met the 80% payment claimed by Medicare.
- People were given a quiz on AIDS awareness. Results were compared by age group to see which age group was the most aware.
- Prices between Cubs, Krogers, and Eagles were compared to see if Cubs really is the lowest price, as claimed.
- People were asked the same question in a different way to see if the way the question is phrased makes a difference in the answers.
While you are not precluded from doing the above, it is certainly better if you can come up with something original which has an interest to you. Things like the KFC/Hardees debate, while acceptable, are really poor choices.
Make sure you get the project cleared with me before you go collect the data. One person wanted to telephone survey some people and was talking in the range of $100 phone bill if she called everyone she said she was going to. The project should not cost you very much money to implement. It will take some time, however, and you should not wait until it’s due to get started on it.
Last updated: Saturday, June 10, 1995 at 3:33 pm
Send comments to james@richland.edu .




 Case study methodology dissertation proposal
 Batayang teoretikal sa thesis proposal
 Cover page master thesis proposal
 Dissertation proposal sample pdf document
 William h mcraven thesis proposal


