When you are evaluating a hypothesis, you need to account for both the variability in your sample and how large your sample is.
Introduction
Hypothesis testing is generally used when you are comparing two or more groups.
For example. you might implement protocols for performing intubation on pediatric patients in the pre-hospital setting. To evaluate whether these protocols were successful in improving intubation rates, you could measure the intubation rate over time in one group randomly assigned to training in the new protocols, and compare this to the intubation rate over time in another control group that did not receive training in the new protocols.
When you are evaluating a hypothesis, you need to account for both the variability in your sample and how large your sample is. Based on this information, you’d like to make an assessment of whether any differences you see are meaningful, or if they are likely just due to chance. This is formally done through a process called hypothesis testing.
Five Steps in Hypothesis Testing:
Step 1: Specify the Null Hypothesis
The null hypothesis (H0 ) is a statement of no effect, relationship, or difference between two or more groups or factors. In research studies, a researcher is usually interested in disproving the null hypothesis.
Examples:
- There is no difference in intubation rates across ages 0 to 5 years.
- The intervention and control groups have the same survival rate (or, the intervention does not improve survival rate).
- There is no association between injury type and whether or not the patient received an IV in the prehospital setting.
- The intubation success rate differs with the age of the patient being treated (two-sided) .
- The time to resuscitation from cardiac arrest is lower for the intervention group than for the control (one-sided) .
- There is an association between injury type and whether or not the patient received an IV in the prehospital setting (two sided) .
- P-value = 0.01 This will happen 1 in 100 times by pure chance if your null hypothesis is true. Not likely to happen strictly by chance.
- P-value = 0.75 This will happen 75 in 100 times by pure chance if your null hypothesis is true. Very likely to occur strictly by chance.
- Average ages were significantly different between the two groups (16.2 years vs. 16.7 years; p = 0.01; n=1,000). Is this an important difference? Probably not, but the large sample size has resulted in a small p-value.
- Average ages were not significantly different between the two groups (10.4 years vs. 16.7 years; p = 0.40, n=10). Is this an important difference? It could be, but because the sample size is small, we can’t determine for sure if this is a true difference or just happened due to the natural variability in age within these two groups.
- P-value = significance level (a) = Reject your null hypothesis in favor of your alternative hypothesis. Your result is statistically significant.
- P-value significance level (a) = Fail to reject your null hypothesis. Your result is not statistically significant.
- H0. There is no difference in survival between the intervention and control group.
- H1. There is a difference in survival between the intervention and control group.
- a = 0.05; 20% increase in survival for the intervention group; p-value = 0.002
- Reject the null hypothesis in favor of the alternative hypothesis.
- The difference in survival between the intervention and control group was statistically significant.
- There was a 20% increase in survival for the intervention group compared to control (p=0.001).
- H0. There is no difference in survival between the intervention and control group.
- H1. There is a difference in survival between the intervention and control group.
- a = 0.05; 5% increase in survival between the intervention and control group; p-value = 0.20
- Fail to reject the null hypothesis.
- The difference in survival between the intervention and control group was not statistically significant.
- There was no significant increase in survival for the intervention group compared to control (p=0.20).
Step 2: Specify the Alternative Hypothesis
The alternative hypothesis (H1 ) is the statement that there is an effect or difference.
This is usually the hypothesis the researcher is interested in proving. The alternative hypothesis can be one-sided (only provides one direction, e.g. lower) or two-sided. We often use two-sided tests even when our true hypothesis is one-sided because it requires more evidence against the null hypothesis to accept the alternative hypothesis.
Examples:
Step 3: Set the Significance Level (a)
The significance level (denoted by the Greek letter alpha&- a ) is generally set at 0.05. This means that there is a 5% chance that you will accept your alternative hypothesis when your null hypothesis is actually true. The smaller the significance level, the greater the burden of proof needed to reject the null hypothesis, or in other words, to support the alternative hypothesis.
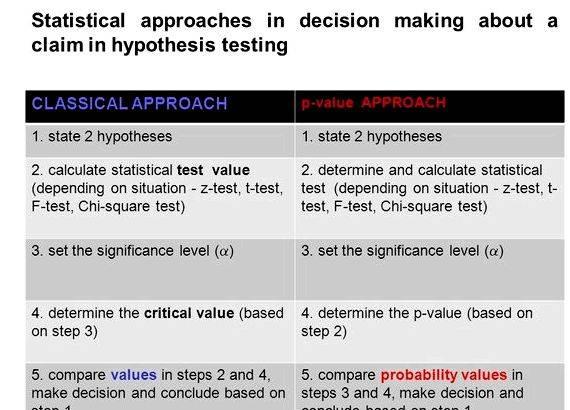
Step 4: Calculate the Test Statistic and Corresponding P-Value
In another section we present some basic test statistics to evaluate a hypothesis. Hypothesis testing generally uses a test statistic that compares groups or examines associations between variables. When describing a single sample without establishing relationships between variables, a confidence interval is commonly used.
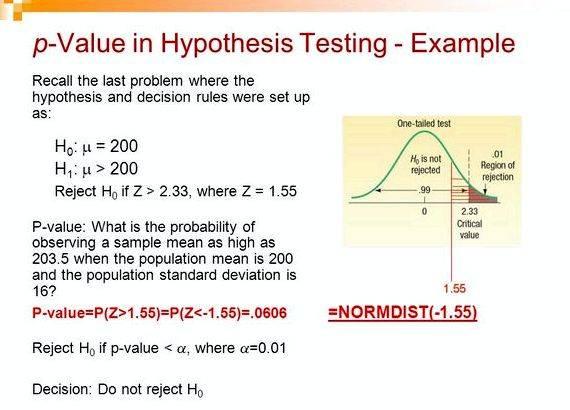
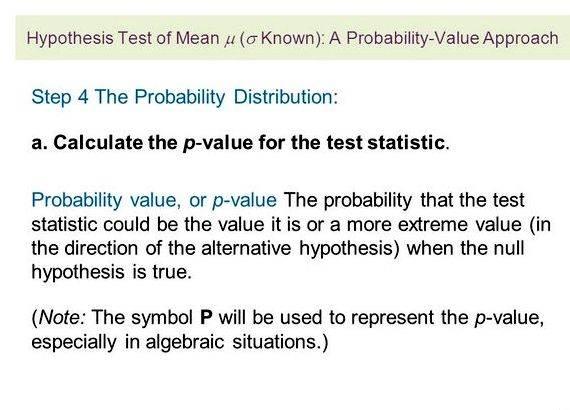
The p-value describes the probability of obtaining a sample statistic as or more extreme by chance alone if your null hypothesis is true. This p-value is determined based on the result of your test statistic. Your conclusions about the hypothesis are based on your p-value and your significance level.
Example:
Example:
Cautions About P-Values
Your sample size directly impacts your p-value. Large sample sizes produce small p-values even when differences between groups are not meaningful. You should always verify the practical relevance of your results. On the other hand, a sample size that is too small can result in a failure to identify a difference when one truly exists.
Plan your sample size ahead of time so that you have enough information from your sample to show a meaningful relationship or difference if one exists. See calculating a sample size for more information.
Example:
Example:
If you do a large number of tests to evaluate a hypothesis (called multiple testing ), then you need to control for this in your designation of the significance level or calculation of the p-value. For example, if three outcomes measure the effectiveness of a drug or other intervention, you will have to adjust for these three analyses.
Step 5: Drawing a Conclusion
Hypothesis testing is not set up so that you can absolutely prove a null hypothesis. Therefore, when you do not find evidence against the null hypothesis, you fail to reject the null hypothesis. When you do find strong enough evidence against the null hypothesis, you reject the null hypothesis. Your conclusions also translate into a statement about your alternative hypothesis. When presenting the results of a hypothesis test, include the descriptive statistics in your conclusions as well. Report exact p-values rather than a certain range. For example, The intubation rate differed significantly by patient age with younger patients have a lower rate of successful intubation (p=0.02). Here are two more examples with the conclusion stated in several different ways.
Example:
Conclusion:
Example:
Conclusion:




 Jessica mott pay me to do your homework
 Buy penile prosthesis for girls
 Impulse buying behavior thesis sample
 Impulse buying behavior thesis proposal
 Pay to do my accounting homework
