1.17 Using tables and figures
Many types of writing will include tables or figures to present data or provide illustrations or clarification. It is important, however, that these are presented correctly and appropriately; that they are clear and easy to understand, and that they aid your reader in following your argument.
Figures are graphs, diagrams or illustrations/images.
Tables are data presented in tabular form.
Basic considerations when using figures and tables
1 Figures and tables are not a replacement for your text. They should supplement your writing, add evidence to make your argument stronger, help your reader to understand complicated ideas or complex figures. Always ask yourself why you are including a particular figure. If it’s just to pad your writing out or make it look pretty, then forget it; your figure or table must always serve a purpose.
2 Your figures must be an integral part of your writing; don’t just throw one or two in at random. Your text should always refer to the figures or tables that you’ve included, with explanations and comments on the data or illustrations presented (see examples below).
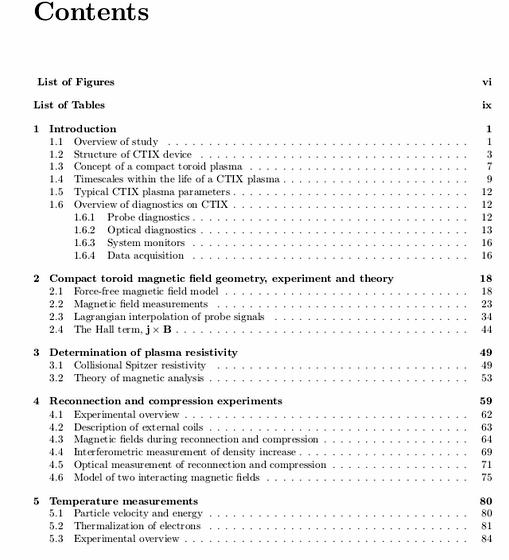
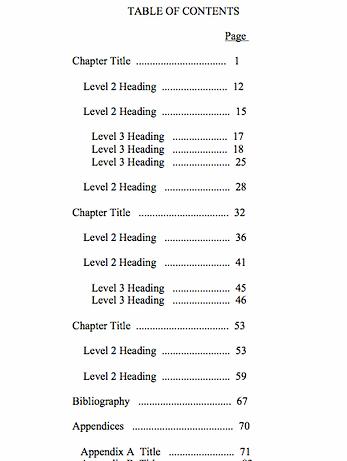
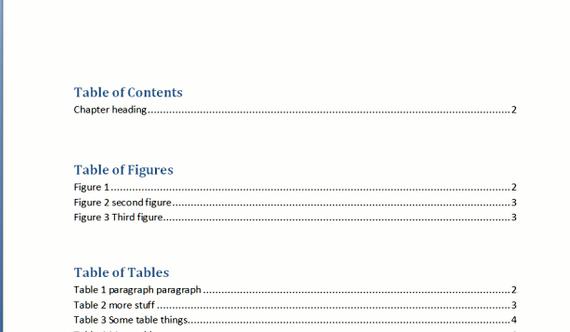
3 All figures and tables must be given a title and be consecutively numbered, and these would normally be listed separately in your assignment, dissertation or thesis (usually at the beginning). Within your text, Table must always be written out in full, but Figure can be written Fig, Fig. or Figure; never use ‘;the’ before the words,and always use actual numbers. In a longer piece of work, these numbers would correspond to the chapter numbers(Fig 3.5; Table 2.1 etc)
4 If the figure has been taken from one of your sources, you must make a reference to this source.
The best way to do this is like you would do with any other acknowledgement; a short reference (surname, year of publication and page number as it’s from a specific page) within your text, after the title of the figure/table, and then the full reference at the end as part of your main list of references. You may sometimes see the full reference given with the figure/table.
5 The number and title must always accompany the figure or table in your text. Usually, this is put below a figure (often in italics), and above a table (usually not in italics). Don’t worry too much about this, but make sure that you are consistent.
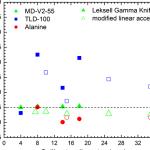
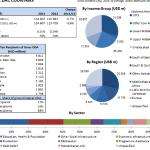
6 Make sure that any data you present in this form is clear and easily understood. If you have to use colour or shading ensure that it does not obscure the text, but it is recommended that you do not use colour. Also make sure that the categories, scales, groups etc that you are presenting are clearly labelled on the appropriate axis of the graph or table column.
Notice the reference here to the source of this figure.
Referring to tables and figures in your text
You must always refer in your text to a table or figure that you have included. You should do this using impersonal language. For example:
Fig 4.1 shows an example of the type of engraving common in the late 19th
Century. This is a good illustration of &…
As shown in Table 2.2, although the incidences of gun-related crime have
increased in the UK, they are still low compared with most countries in the
developed world.
Literacy rates have also increased dramatically (see Fig 1.3).
Try to include your figure or table as close as possible to the text to which it relates, but without splitting it across two pages. Do not use expressions such as as shown in the table below or the table above shows, nor put the page the figure appears on; just use the number, as in the examples.
Links to further resources on using tables and figures
1.17 Using tables and figures
Many types of writing will include tables or figures to present data or provide illustrations or clarification. It is important, however, that these are presented correctly and appropriately; that they are clear and easy to understand, and that they aid your reader in following your argument.
Figures are graphs, diagrams or illustrations/images.
Tables are data presented in tabular form.
Basic considerations when using figures and tables
1 Figures and tables are not a replacement for your text. They should supplement your writing, add evidence to make your argument stronger, help your reader to understand complicated ideas or complex figures. Always ask yourself why you are including a particular figure. If it’s just to pad your writing out or make it look pretty, then forget it; your figure or table must always serve a purpose.
2 Your figures must be an integral part of your writing; don’t just throw one or two in at random. Your text should always refer to the figures or tables that you’ve included, with explanations and comments on the data or illustrations presented (see examples below).
3 All figures and tables must be given a title and be consecutively numbered, and these would normally be listed separately in your assignment, dissertation or thesis (usually at the beginning). Within your text, Table must always be written out in full, but Figure can be written Fig, Fig. or Figure; never use ‘;the’ before the words,and always use actual numbers. In a longer piece of work, these numbers would correspond to the chapter numbers(Fig 3.5; Table 2.1 etc)
4 If the figure has been taken from one of your sources, you must make a reference to this source. The best way to do this is like you would do with any other acknowledgement; a short reference (surname, year of publication and page number as it’s from a specific page) within your text, after the title of the figure/table, and then the full reference at the end as part of your main list of references. You may sometimes see the full reference given with the figure/table.
5 The number and title must always accompany the figure or table in your text. Usually, this is put below a figure (often in italics), and above a table (usually not in italics). Don’t worry too much about this, but make sure that you are consistent.
6 Make sure that any data you present in this form is clear and easily understood. If you have to use colour or shading ensure that it does not obscure the text, but it is recommended that you do not use colour. Also make sure that the categories, scales, groups etc that you are presenting are clearly labelled on the appropriate axis of the graph or table column.
Notice the reference here to the source of this figure.
Referring to tables and figures in your text
You must always refer in your text to a table or figure that you have included. You should do this using impersonal language. For example:
Fig 4.1 shows an example of the type of engraving common in the late 19th
Century. This is a good illustration of &…
As shown in Table 2.2, although the incidences of gun-related crime have
increased in the UK, they are still low compared with most countries in the
developed world.
Literacy rates have also increased dramatically (see Fig 1.3).
Try to include your figure or table as close as possible to the text to which it relates, but without splitting it across two pages. Do not use expressions such as as shown in the table below or the table above shows, nor put the page the figure appears on; just use the number, as in the examples.
Links to further resources on using tables and figures




 Types of phd dissertations english
 Eth zurich phd management dissertations
 Dissertation writing services illegal tender
 Operations research phd dissertation outline
 Dissertation proposal sample business letters
