


Labelling figures in your report
Figures must be clearly labelled so they can be accurately referred to in your written discussion. Each figure should have a title and a number, for example:
Figure 1: Retention rates of Year 10 students in NSW public schools in 1998-2001.
Table 5: Means scores and standard deviations from Experiment 2.
Note in the examples above that the number of the figure is presented as a numeral in the title of the figure. The number of the figure is also presented as a numeral when the figure is referred to in the text of the report.
You may choose to label diagrams, tables and figures as Figures or you may choose to label diagrams and graphs as Figures and tables as Tables. In the latter case the numbering used for figures and tables would be separate. The numbering of figures should proceed chronologically (1, 2, 3, etc. ) or may relate to chapter or section numbers (i.e. 1.1, 1.2, etc. 2.1, 2.2, etc. 3.1, 3.2, etc.). As long as the numbering system you choose is logical and you use it consistently, variations should be acceptable.
The title of your figure should include enough information to enable the figure to be self-explanatory ; for example, the title
Figure 1: Retention rates
would be inadequate. This title could be improved by adding enough information so its content is self-explanatory; for example,
Figure 1: Retention rates of Year 10 students in NSW public schools in 1998-2001.
In fact, from the figure title and the axis labels of a graph/table the reader should be able to determine the question being asked, get a good idea of how the study was done, and be able to interpret the figure without reference to the text.

In the sciences in particular, it is expected that your figure legends will be quite detailed and very precise.
This is probably a reaction to many journal readers only having time to scan an article instead of reading it in its entirety; for example, refer to the figure below for a good example of a figure title and legend.
Figure 1. Effect of various antibiotic media on growth of four strains of E. coli (EC1, EC2, EC3 and EC4) isolated from nappies of babies at a Casey hospital. Strains were grown on media containing either no antibiotics (none), 5mg/ml streptomycin, 5mg/ml chloramphenicol or 5mg/ml streptomycin and 5mg/ml chloramphenicol (chlor. + strep.). Bacterial growth was scored as number of colonies present after three days of growth at 37C. Data is expressed as the mean number of colonies on each medium (n=10). Vertical bars show standard errors of the mean.
Figures which are replicated from someone else’s work should be acknowledged; for example,
Figure 13: An example of a typical novice problem categorisation (from Chi, Feltovich and Glaser, 1981, p. 264).
How you reference the figure will depend on the referencing style you have used throughout your report but you should include the page number the figure was taken from.
If your report includes a large number of figures and tables it is advisable to create a new list/s after the table of contents called the ‘table of figures’ and the ‘table of tables’ (if required). In the ‘table of figures and the ‘table of tables’ list the titles of your figures and the number of the page they can be located upon.

 Dissertation proposal topics law cornell
 1492 the year the world began thesis proposal
 Inflibnet ugc phd thesis proposal
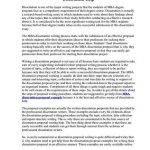 Writing a proposal for dissertation
 Dissertation proposal topics marketing articles


